Skip to content
Sample market data
New Registrations Coming Soon! We're onboarding users in waves — check back shortly. Existing users can still sign in.
Portfolio Tracking & Research Tools

Every asset you own. One ledger.

Stocks, ETFs, options, bonds, crypto and cash — across accounts, entities and 11 currencies, with US and Canadian tax reference data from the same records.

  • Track stocks, ETFs, options, bonds, crypto, cash and property side by side
  • Estimated capital-gains reference data for US and Canadian filings
  • Import from 12 brokerages without giving anyone your brokerage login

Free to start — no credit card required. Every new account includes a 14-day Pro trial.

Your total cost (Cost Basis), current value (Market Value), and profit or loss (Unrealized P&L) — at a glance.

Dashboard
Market Value$284,520▲ +12.4%
Cost Basis$253,100
Unrealized P&L▲ +$31,420
AAPLApple Inc.$42,800▲ +18.2%
MSFTMicrosoft$38,250▲ +22.7%
RY.TORoyal Bank$28,100▲ +8.4%
NVDANVIDIA$24,600▲ +45.1%

If you own it, it belongs here

Most trackers cover stocks and stop. This one keeps going.

StocksUS & Canadian exchangesETFsOverlap analysisOptionsFull contract lifecycleBondsAccrued interest & maturityCryptoAlongside your equitiesCash11 currenciesPropertyNet worth & liabilities
12Brokerage Imports
US & CAMarkets Covered
11Currencies
8AI Research Tools*
128+Features
LiveMarket Quotes

* AI Research Tools are available on Standard and Pro plans; grounded search and the voice assistant are Pro only. Quotes update automatically during market hours; market data may be delayed up to 15 minutes depending on the exchange.

How It Works

Up and Running in Minutes

Three simple steps to start tracking your portfolio.

1

Sign up free

Create your account in seconds. No credit card required.

2

Import your trades

Upload a CSV from your brokerage or enter trades manually. 12 parsers built in.

3

Monitor & research

Track performance, explore AI tools, review estimated tax data, and set alerts.

Features

Tools for Every Stage of Your Investment Journey

From first trade to portfolio-wide analysis. Informational tools designed to help you stay organized — not to replace professional advice.

Track What You Paid for Each Stock

Every buy and sell is logged automatically. Your estimated cost basis and unrealized P&L stay up to date — no spreadsheets needed.

Prices Updated Automatically

Quotes and sparkline charts for all your positions, refreshed automatically throughout the trading day. Supports US and Canadian exchanges with automatic ticker recognition. Market data may be delayed up to 15 minutes depending on the exchange.

Monitor Your Portfolio Performance

Time-weighted returns, benchmark comparison, and clear charts to help you understand how your investments have performed historically.

Multi-Currency Support

Choose any of 11 supported currencies as your base. Live FX rates with caching and historical rate management for cross-border portfolios.

Watchlists & Price Alerts

Monitor stocks with custom watchlists, set price alerts, and get notified via email, browser push, or webhook when thresholds are crossed.

Estimated Tax Reports (US & CA)

Generate estimated capital gains summaries, Form 8949 (US) and T5008 (CA) reference data, wash sale flags, and “What If I Sell” scenarios. Not tax advice — consult a tax professional.

Dividend & Income Tracking

Log dividends, detect missing entries, view projected income estimates, and track corporate actions like splits, mergers, and spinoffs.

Customizable Dashboard

Drag-and-drop widgets, layout presets, portfolio health indicators, allocation charts, and goal tracking — your personalized overview.

Secure & Private

Row-level security on every query. Your data stays yours — full backup and CSV export on Standard and Pro plans.

AI Research Assistant

Ask questions about your portfolio in plain English, get AI-generated research notes, and use natural-language screening. For informational purposes — not investment advice.

Smart Monitoring Tools

Surface potential tax-loss harvesting opportunities, rebalancing drift, and concentration alerts. Informational highlights to discuss with your advisor.

Planning Calculators

Retirement projections, RRSP meltdown and RESP calculators, Social Security modeling, and net worth tracking. Estimates only — not financial advice.

Research & Screening

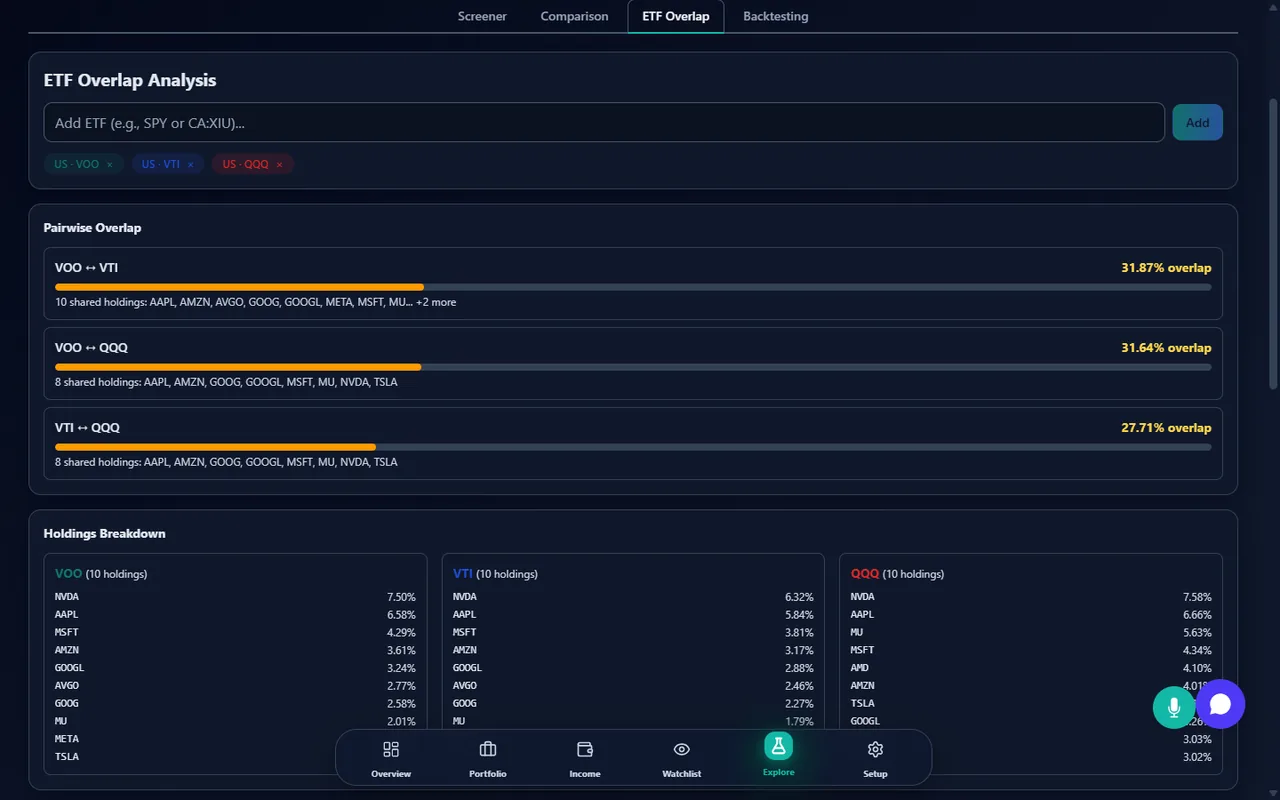
Stock screener, side-by-side comparison, ETF overlap analysis, and backtesting tools to help inform your own research process.

Explore all features

Where simple trackers stop

Three capabilities that most portfolio trackers never build.

Options lifecycle panel showing a written call option resolved by assignment into the underlying stock position

The full options lifecycle, not just a position count

Write a covered call, close it early, or let it run to expiration — assignment and exercise are resolved as real position-changing events on the same ledger as every other trade, not bolted on as a side note.

Bond analytics card showing accrued interest, yield to maturity, and duration for a fixed-income holding

Bonds priced like bonds, not like stocks

Enter face value, coupon rate, and maturity date, and get estimated accrued interest, yield to maturity, and duration — the numbers a fixed-income holding actually needs, not a repurposed equity row.

Consolidated household view aggregating holdings across a trust, a corporation, and two individual portfolios

One household, every entity, one view

Trusts, corporations, estates, and individual family members each keep their own transaction ledger — and roll up into a single consolidated household view whenever you need the whole picture.

US and Canadian tax reference, from the same ledger

One set of transactions, two jurisdictions of estimated tax preparation data.

United States

  • Form 8949Estimated Form 8949 rows and Schedule D reference built from your realized gains and losses.
  • Wash sale flagsInformational flags when a repurchase falls inside the 30-day wash-sale window.
  • NIITEstimated Net Investment Income Tax based on your filing status and MAGI.
  • AMT creditMinimum Tax Credit carryforward estimated year over year, referencing Form 8801.
  • Section 1256Estimated 60/40 mark-to-market treatment for index options and other Section 1256 contracts.

Canada

  • T5008T5008 disposition data reconciled against your own transaction ledger.
  • Adjusted cost baseAdjusted cost base tracked per security using the average-cost method, including return of capital and DRIP.
  • Superficial lossInformational superficial-loss flags across your accounts and affiliated persons within the 30-day window.
  • TFSA / RRSP contribution roomTFSA and RRSP room estimated year over year, including carry-forward and withdrawals added back.
  • Dividend tax creditEstimated federal and provincial dividend tax credit on eligible and non-eligible Canadian dividends.
See full tax reporting

Free standalone calculators

All figures above are estimated reference data for tax preparation, not a filed return — and this is not tax advice. Tax rules vary by jurisdiction and individual circumstances; always consult a qualified tax professional before filing.

IMPORT YOUR DATA

Works With Your Brokerage

Import transactions from 12 major brokerages via CSV. Preview before importing — your data stays under your control.

Your data, your credentials

“Does it sync with my broker automatically?” No — and that's deliberate. You export a CSV, we parse it, you decide what gets saved.

No third party ever holds your brokerage login

We don't ask for your brokerage username or password, and no third party is given your brokerage credentials. There is nothing to hand over because nothing is aggregated on your behalf.

12 purpose-built parsers, one per brokerage

You export a CSV from your brokerage and upload it. A parser built specifically for that brokerage's format reads it — no generic best-effort guessing.

Preview every row before anything is saved

See exactly what would be imported — every transaction, every field — and confirm it before a single row is written to your ledger.

Full export and an audit-ready ledger

Everything you import can be exported back out at any time, alongside an audit-ready ledger recording every change made to your data.

Read Our Security PageSee Supported Brokerages
Deep Dive

Built for Serious Investors

Explore the tools that make StockWatcher a comprehensive portfolio tracking platform.

Intelligent Dashboard

A fully customizable overview with drag-and-drop widgets, multiple layout presets, and quotes streamed to the open page as they refresh.

  • Drag-and-drop widget reordering
  • Multiple layout presets: Balanced, Focus, Timeline
  • Portfolio health indicators and goal tracking
Intelligent Dashboard

Holdings Analysis

Go beyond simple lists with treemaps, sector allocation, geographic breakdowns, and style-box visualizations.

  • Treemap and sector/geographic allocation charts
  • Target allocation and rebalancing tools
  • Holdings reconciliation via CSV comparison
Holdings Analysis

Performance Tracking

View historical returns with XIRR calculations, benchmark overlays, and attribution breakdowns to understand past performance.

  • XIRR time-weighted return calculations
  • Benchmark comparison with custom indices
  • Net invested over time visualization
Performance Tracking

AI-Powered Research Tools

Conversational AI assistant, auto-generated research notes, and natural-language stock screening. Informational tools to support — not replace — your own judgment.

  • Ask portfolio questions in plain English
  • AI-generated stock research notes
  • Natural-language screening: describe criteria, see results
Learn more
AI-Powered Research Tools

Estimated Tax Reporting

Generate estimated capital gains summaries for US and Canadian jurisdictions. Reference data for tax preparation — always consult a qualified tax professional.

  • Form 8949 (US) and T5008 (CA) reference exports
  • Wash sale detection and loss carryforward tracking
  • Tax lot viewer with FIFO and Specific ID methods
  • TFSA / RRSP contribution-room helpers, AMT credit reference, and NIIT exposure flags
Learn more
Estimated Tax Reporting

Alerts & Notifications

Set up above/below price alerts with multi-channel delivery and a full event history log.

  • Multi-channel: webhook, email, push notifications
  • Alert event log with filtering and export
  • Alert statistics overview
Learn more
Alerts & Notifications

How we compare

What each competitor publishes on their own pages — not our summary of them.

A condensed comparison against 10 named competitors, sourced from each vendor's own public pages.
CompetitorKnown forWhere they're the better choiceVerified
SharesightSharesight is a portfolio tracking and tax reporting service for shares, ETFs, funds, and other listed and unlisted investments, sold on tiered monthly and annual plans.Investors holding unlisted investments or precious metals who want those asset types tracked alongside listed shares in one portfolio view, since StockWatcher does not track unlisted securities or physical metals. Investors who want dedicated Taxable Income and Capital Gains Tax reports bundled into every paid tier rather than as a separate add-on.Verified 2026-07-27
WealthicaWealthica is a Canadian account-aggregation dashboard that automatically connects to banks and brokerages to display consolidated holdings, sold on tiered annual and monthly plans.Investors who want their Canadian brokerage and bank accounts aggregated automatically without entering any transactions manually, since Wealthica connects directly to financial institutions and StockWatcher relies on CSV import.Verified 2026-07-27
PassivPassiv is a brokerage-connected rebalancing and automation tool that links to a user's existing brokerage accounts to calculate and place trades, sold as a free tier plus a single paid tier.Investors who want automated rebalancing calculations and one-click trade execution placed directly in their own connected brokerage account — a live-trading capability StockWatcher does not provide, since it only records transactions a user has already made.Verified 2026-07-27
Snowball AnalyticsSnowball Analytics is a portfolio and dividend tracking app covering stocks, ETFs, and funds across a large number of global exchanges and currencies, sold on tiered monthly and annual plans.Investors whose holdings span many international exchanges and currencies and want unlimited holdings tracked across 70+ exchanges and 30+ currencies starting at the entry-level paid tier.Verified 2026-07-27
Yahoo FinanceYahoo Finance is a general financial news and market-data site whose Premium subscription adds portfolio tools, research reports, and screening features on top of the free site, sold on tiered monthly and annual plans.Investors who want expert stock picks, Morningstar ratings for stocks, and thousands of company research reports bundled with a financial news site they may already read daily — research depth StockWatcher does not provide.Verified 2026-07-27
WealthsimpleWealthsimple is a Canadian financial services company offering self-directed and managed investing, crypto, and other account types; account holders view their own holdings inside the Wealthsimple app rather than through a separate tracking product.Canadians who hold all of their investments directly at Wealthsimple and want CRA and Revenu Québec tax slips imported automatically through Wealthsimple Tax, without needing a separate tracking tool for those accounts.Verified 2026-07-27
KuberaKubera is a net-worth tracking dashboard covering a broad range of asset types — from brokerage holdings to real estate, vehicles, and other physical assets — sold on two annual subscription tiers.Individuals who want a single dashboard tracking real estate, vehicles, precious metals, and other physical or private assets alongside brokerage holdings — a breadth of manually valued asset types beyond what StockWatcher's net-worth categories cover.Verified 2026-07-27
getquingetquin is a portfolio tracker with a community and social feed alongside its tracking tools, connecting to brokers via Open Banking or CSV upload, sold on tiered annual plans.Investors who want a portfolio tracker with a built-in social feed and community features alongside Open Banking connections to their broker, without needing to export or import CSV files for every update.Verified 2026-07-27
EmpowerEmpower Personal Dashboard is a free financial account-aggregation and net-worth tool that connects to a user's banking, credit card, and retirement accounts, with paid wealth-management advisory services offered separately.Individuals who want free retirement and net-worth planning tools that also aggregate everyday bank accounts, credit cards, and loans automatically at no cost — account types outside what StockWatcher's manual net-worth entries cover.Verified 2026-07-27
Stock EventsStock Events is a mobile-first stock, dividend, and market-events tracking app with an AI chat assistant and an optional automatic brokerage/exchange sync add-on, sold on a free tier plus a paid annual plan.Investors who want a built-in AI chat assistant answering questions about their tracked stocks, plus dividend and market-event alerts, bundled into a free tier before needing any paid plan.Verified 2026-07-27

Vendor pricing, limits, and features change over time — always check their own site for current details before deciding.

See All Comparisons

Free tools & glossary

Six standalone calculators and a full glossary of investing and tax terms — free, no account required.

RRSP Meltdown CalculatorRESP Calculator with CESGCapital Gains & ACB CalculatorTFSA Contribution Room CalculatorRRSP Contribution Room CalculatorDividend Yield & Income CalculatorGlossary
Explore All Free Tools & Calculators

Simple pricing, real depth

128+ features across three tiers — start free, upgrade only when you need more.

Free

$0

  • 50 transactions (lifetime total)
  • 1 portfolio
  • CSV import
Popular

Standard

$9.99/mo

  • 500 transactions/year
  • 5 portfolios
  • AI Chat & Insights
  • Tax reports

Pro

$24.99/mo

  • Unlimited transactions
  • Unlimited portfolios
  • Backtesting & Screening
  • All tax & planning tools

Free to start — no credit card required. Every new account includes a 14-day Pro trial.

See Full Pricing & Feature Comparison
AVAILABLE EVERYWHERE

Your Portfolio, Any Device

Access your portfolio from your laptop, tablet, or phone. Installable as a Progressive Web App for a native app experience.

StockWatcher on laptop, tablet, and phone

Frequently asked questions

Straight answers about what StockWatcher tracks, how data gets in and out, and what's included at each tier.

Which asset types can I track?

Stocks, ETFs, options, bonds and other fixed income, and crypto — plus cash in 11 currencies. Property and other liabilities can be added in the net-worth view alongside your investment accounts.

Does it connect to my brokerage automatically?

No. Transactions are imported from CSV files you export yourself, using 12 brokerage-specific parsers with a preview step before anything is saved. No third party is ever given your brokerage login.

Does it handle both United States and Canadian tax?

Yes. Both jurisdictions are produced as estimated reference data from the same transaction ledger — Form 8949 and wash-sale flags for the US, T5008 and adjusted cost base for Canada. This is reference information for tax preparation, not tax advice.

What does the free plan include?

Core portfolio tracking: 50 transactions, 1 portfolio, and CSV import. Every new account also starts with a 14-day Pro trial — no credit card required — so you can try the full feature set before choosing a plan.

Can I get my data back out?

Yes. Standard and Pro plans include full CSV export of your transactions and holdings, and deleting your account permanently removes your data.

See All FAQs

Ready to Take Control of Your Portfolio Tracking?

Join investors who organize their portfolios with clarity. Free to get started — upgrade as your needs grow.